
Stock market index
Index measuring stock market performance for investor comparison.

Wikipedia / Wikimedia Commons
A stock market index, often called a stock index, tracks how a stock market—or a specific part of one—is performing. It gives investors a way to compare today’s stock prices with those from the past to gauge market trends. For an index to be useful, it must be investable (meaning people can actually put money into it) and transparent (the rules for how it’s built are clearly laid out). Investors can gain exposure to an index by buying an index fund, which might be a mutual fund or an exchange-traded fund that follows the index’s movements. Any difference between the fund’s performance and the index itself is known as tracking error.
Indices can be grouped by the types of stocks they include, called their coverage. This coverage is separate from how the stocks are weighted. For instance, the S&P 500 market-cap weighted index covers the 500 largest stocks from the S&P Total Market Index, but there’s also an equally weighted S&P 500 index with the same stock list.
**World or global coverage** aims to reflect the entire global stock market. The MSCI World includes nearly 1,400 stocks from 23 developed countries, covering about 85% of their free float-adjusted market value. The FTSE Global Equity Index Series goes further, with over 16,000 companies, while the S&P Global 100 is more focused, with just 100.
**Regional coverage** tracks stocks from a single geographic area, like the FTSE Developed Europe Index or the FTSE Developed Asia Pacific Index.
**Country coverage** follows the stock market of one nation, often signaling investor sentiment about that country’s economy. Well-known examples include the DAX (Germany), NIFTY 50 (India), Nikkei 225 (Japan), KSE 100 (Pakistan), FTSE 100 (UK), and S&P 500 (US).
**Exchange-based coverage** groups stocks by the exchange they trade on, such as the NASDAQ-100, or by a set of exchanges, like the Euronext 100 or OMX Nordic 40.
**Sector-based coverage** focuses on specific market segments, like the Wilshire US REIT Index (over 80 real estate investment trusts) or the NASDAQ Biotechnology Index (about 200 biotech firms).
Indices also differ by how they weight stocks, independent of their coverage. For example, the S&P 500 and S&P 500 Equal Weight both cover the same stocks, but the first uses market capitalization weighting, while the second gives each stock equal importance. Many indices add limits, like concentrati
- field
- Finance
- known_for
- Measuring stock market performance
- key_criteria
- Investable and transparent
- common_investment_vehicle
- Index fund (mutual fund or exchange-traded fund)
- tracking_error
- Difference between index fund performance and the index
Lore & Background
Indices are also categorized by weighting method, independent of coverage. Common methods include market-capitalization weighting, free-float adjusted market-capitalization weighting, price weighting (e.g., Dow Jones Industrial Average), equal weighting, fundamental factor weighting, factor weighting (e.g., smart beta strategies), volatility weighting, and minimum variance weighting. For example, the S&P 500 is market-cap weighted, while an equally weighted S&P 500 index also exists with the same coverage.
Reader's Guide
Stock market indices serve as essential benchmarks for investors, enabling comparison of current price levels with past data to gauge market performance. Their significance lies in providing a transparent and investable measure of market segments, from global markets to specific sectors or countries. The distinction between coverage and weighting methods allows for diverse index designs, such as market-cap weighted indices that are mean-variance efficient under the capital asset pricing model, or equal weight indices that produce less concentrated portfolios. Investors can gain exposure to an index through index funds, which track the index and may exhibit tracking error. The variety of weighting methods—including price weighting, fundamental factor weighting, and volatility weighting—offers different risk-return profiles, though some methods like price weighting are considered unattractive as benchmarks for passive strategies due to distortions from stock splits. Overall, indices are foundational tools for portfolio construction, performance evaluation, and passive investing.
Did You Know?
- The MSCI World index covers approximately 85% of the free float-adjusted market capitalization in 23 developed countries.
- A price-weighted index can be thought of as a portfolio with one share of each constituent stock.
- Free-float adjustments exclude closely or strategically held shares not generally available to the public market.
- The S&P 500 and the S&P 500 Equal Weight cover the same group of stocks but use different weighting methods.
Crash Versus Bear Market: A Fundamental Distinction
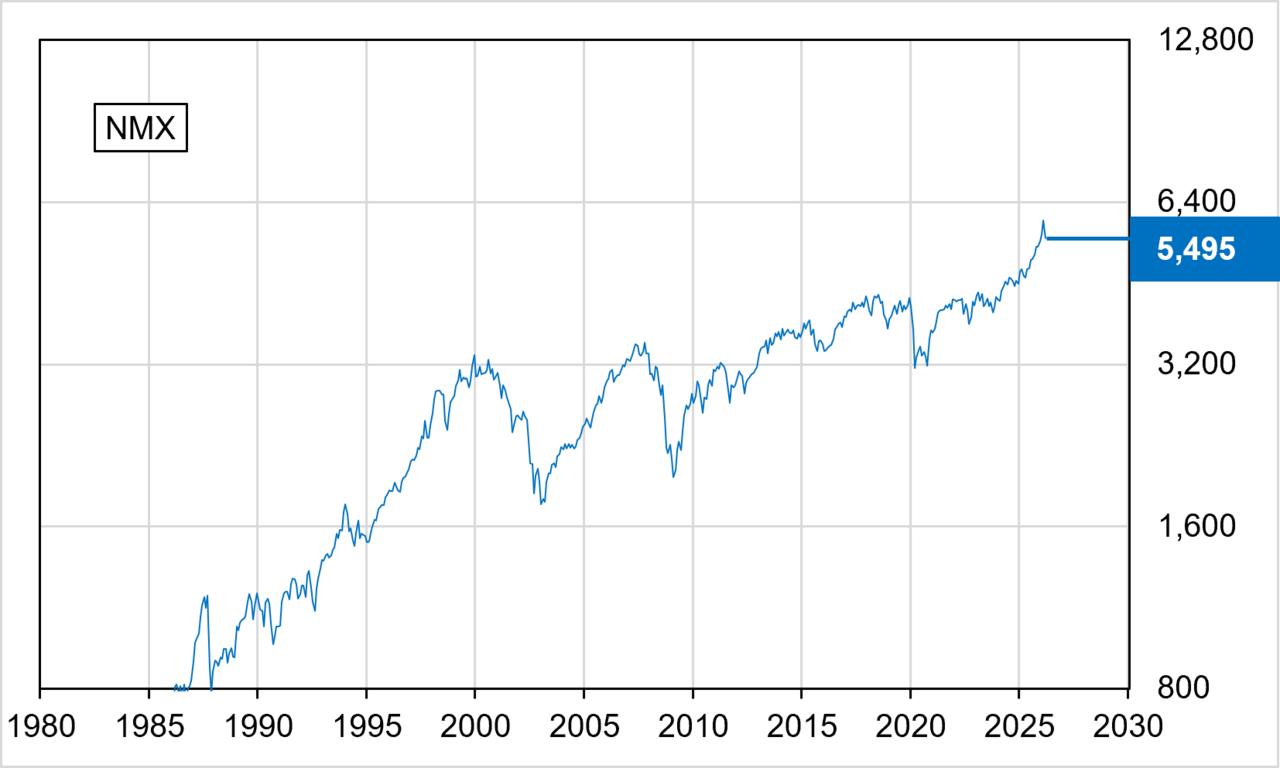
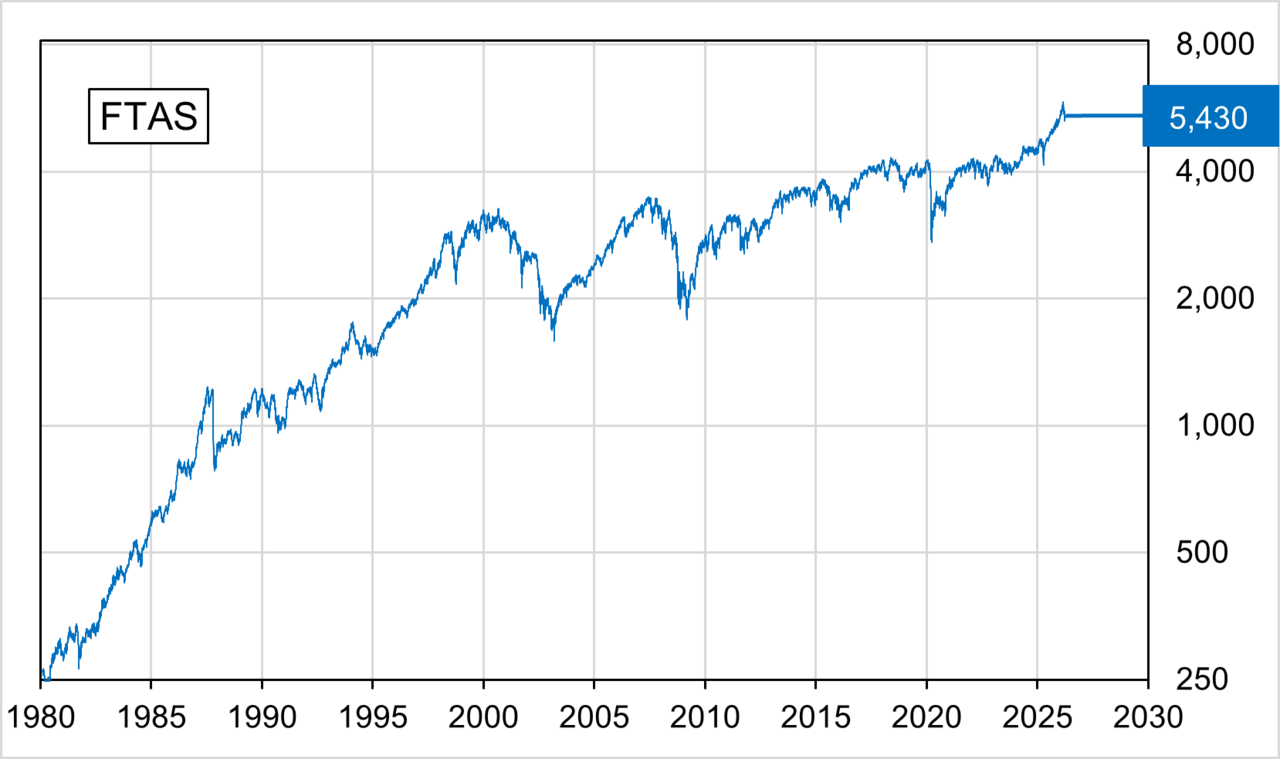
At the heart of any discussion about equity market downturns lies a critical terminological divide that separates two often-conflated phenomena. A stock market crash is defined by its velocity and brevity; it is a rapid, sharp plunge in index values that unfolds over a compressed window of time. A bear market, by contrast, is characterized by a gradual, extended slide in which losses accumulate over a much longer horizon. The rate of decline and the timeframe over which the descent occurs are the two axes along which these categories are distinguished. Understanding this distinction matters because the economic, psychological, and policy responses to a sudden crash differ markedly from those triggered by a slow, grinding bear market. Investors, regulators, and commentators must recognize that a two-day freefall and an eighteen-month erosion of portfolio value are fundamentally different experiences, even though both ultimately register as losses on a balance sheet. The list of such events serves as a taxonomy that keeps these two categories clearly separated rather than lumping all downturns into a single undifferentiated bucket.
Independence of the Two Downturn Types
One of the most important clarifications embedded in the study of market declines is that crashes and bear markets do not automatically travel together. A market can experience a violent, short-lived crash without ever entering a prolonged bear phase, and conversely, a slow, grinding bear market can unfold without any single dramatic crash punctuating its trajectory. This independence means that the presence of one phenomenon does not guarantee or predict the other. For an investor monitoring indices, this has practical implications: the absence of a headline-grabbing crash does not immunize a portfolio from a sustained bear market, and the occurrence of a sharp one-day selloff does not necessarily signal the beginning of a multi-year decline. Recognizing that these two categories operate on separate timelines and at different speeds helps prevent the cognitive shortcut of assuming that every crash is the opening act of a bear market, or that every bear market must contain a spectacular crash at its midpoint. The historical record, as catalogued in dedicated lists of both types, reinforces that the two can appear, disappear, and reappear on their own schedules.
A Global Tapestry of Financial Turbulence
The cataloguing of stock market crashes and bear markets does not stop at any single nation's borders. The broader web of related economic events stretches across multiple countries and multiple asset classes. In India, both the 1991 economic crisis and a dedicated record of stock market crashes illustrate how emerging markets experience their own distinct waves of financial stress. In the United Kingdom and the United States, separate lists of recessions document how equity downturns intertwine with broader macroeconomic contractions. The Dow Jones Industrial Average, in particular, has its own record of the largest single-day changes, serving as a barometer for American market volatility. Beyond equities, the phenomenon of economic bubbles, the separate category of banking crises, and the wider family of economic crises all form a connected ecosystem of financial instability. Together, these related lists paint a picture in which stock market turbulence is one visible symptom within a much larger, globally distributed pattern of economic fragility that no single index can fully capture.
Scholarship and the Documentation of Financial Panic
The academic and literary record surrounding market crashes reveals a deep tradition of chronicling financial panic. Robert Sobel's 1988 volume, Panic on Wall Street, stands as a notable example of this tradition. Published by Truman Talley Books under the Dutton imprint, the work positions itself as a classic history of America's financial disasters while simultaneously offering a fresh examination of the 1987 crash, which was still a recent and vivid memory at the time of publication. The fact that a single book could serve both as a sweeping historical survey and as a targeted case study of one particular crash underscores the layered nature of financial history: each new event both illuminates and is illuminated by the patterns of its predecessors. Sobel's ISBN (0-525-48404-3) anchors the volume in the publishing record of the late 1980s, a period when the memory of Black Monday was still shaping public discourse about market fragility. Such works remind readers that the lists of crashes and bear markets are not merely data tables but the raw material for sustained intellectual inquiry into why markets fail and how societies process collective financial trauma.
Gallery
More in Stock Markets & Finance 1-18
Spotted an error? Know more?
This is a living reference — every entry is fact-audited, and reader corrections feed straight into our audit queue. Suggest an edit · See this site's audit record